Customized telemetry for complete software reliability. Automatically.

Sylogic AI recommends what to measure based on your business priorities. It continuously offers merge-ready fixes for telemetry blind-spots, monitoring your existing repos and observability platforms. Achieve proactive reliability so your teams can build better, faster.
Sylogic
Sylogic Background

Goodbye observability bloat. Hello context-aware reliability.

Observability bloat is crippling

Collect too much unnecesary dataToo much noise, not enough signalIncidents take too long to resolveEach team has own standards, abilities and maturityObservability tools are expensive and hard to scaleMonths to implement new metrics via laborious, brittle manual processIncomplete or outdated business context within your telemetry

Proactive, business-aware reliability so your teams can focus on building

Collect only telemetry you need Context-rich data for deep insightsResolve incidents fast with complete, aligned telemetryConsistent, policy-driven observability across the orgObservability efficiencyTelemetry stays up to standards as code changesObservability always aligned with current business goals

See Sylogic in Action

Watch how our AI-powered observability transforms your monitoring workflow in real-time

See Sylogic in Action
YouTube

Ready to transform your observability?

Get Early Access

Give your SREs superpowers

Remove risks of lost tribal-knowledge and 'What changed?'

Generate github activity reports, architecture and sequence diagrams for your stack at any level of granularity thanks to Sylogic's proprietary code indexing technology.
Create system architecture diagram.

I've completed the system architecture below. Let me know if you would like to see a sequence diagram or other views.

Alt text

Always on the lookout for what’s missing. Offers fixes.

Run a coverage report to understand what your code is instrumented for. Or have Sylogic recommend best-practices SLIs/SLOs for your service patterns and generate a detailed gap and remediations report.

Based on your app being a chat, I recommend adding these SLIs:.

Service Level Indicators (SLIs)

Overall SLI Coverage
Add libraries and merge PRs.
60%Auto Coverage
18%Auto Gap
13%Manual
10%ManualGap
API Response Times
Add libraries and merge PRs.
45%Auto Coverage
25%Auto Gap
20%Manual
10%ManualGap

Message Delivery Latency SLI
Add libraries and merge PRs.
75%Auto Coverage
10%Auto Gap
5%Manual
10%ManualGap

Would you like to add instrumentation for these 2 new SLIs?

Let's add the Message Delivery Latency SLI.

Got it. I've prepared a PR that adds OpenTelemetry spans and dashboards for tracking message_delivery_latency_p95

PR SY526: Add Message Delivery Latency SLI Instrumentation
custom_spanchat_slilow_complexity
Gap Identified: Latency of core chat message delivery is not currently measured, making it difficult to track p95 delivery times.
Suggested Approach: Instrument the message delivery path with a custom span to capture delivery duration from enqueue to client acknowledgment.
Attributes to Capture:
message.idconversation.iduser.idtenant.iddelivery.status
Impact: Captures latency insights for individual message deliveries, enabling p95 and p99 delivery time calculations and alerting per tenant or conversation.
Sample Code:
// Custom span for message delivery latency
  const tracer = opentelemetry.trace.getTracer('chat-app');
  
  async function deliverMessage(message, context) {
    const span = tracer.startSpan('message.delivery.latency', {
      attributes: {
        'message.id': message.id,
        'conversation.id': message.conversationId,
        'user.id': message.senderId,
        'tenant.id': context.tenantId
      }
    });
  
    try {
      await enqueueMessage(message);
      await awaitClientAck(message.id);
      span.setAttribute('delivery.status', 'acknowledged');
    } catch (error) {
      span.setAttribute('delivery.status', 'failed');
      throw error;
    } finally {
      span.end();
    }
  }

Would you like to review the complete code changes?

Not right now. What's the avg api response time and error rate in the past 24 hours?

Within the past 24 hours:

Average API response time: 320 ms
Error rate: 1.3% (312 errors out of 24,000 requests)

show me the slowest endpoint within the last 24 hours

The slowest endpoint in the past 24 hours was POST /api/reports/export with an average response time of 1.8s and a p95 of 3.2s.

show me the response times for that endpoint over the past 30 days

Here's the average response time for POST /api/reports/export over the past 30 days.

Average API Response Time (Last 30 Days)
Average response time for `POST /api/reports/export` over the past 30 days.
Growing by 1000% over 24 months
Projected monthly traffic growth based on historical data and market trends

Continuous drift protection.

Sylogic will generate Git Pull Requests to remediate all identified instrumentation gaps against best practices. Tailor your policy to reflect your precise needs and business context. Sylogic is your new Observability Engineer, keeping an eye on your code to detect any drift from best practices and automatically generate fixes.

I noticed new code was added, but not instrumented. I generated the PR below to fix the gap.

PR SY526: Add E2E Kafka Message Delivery Latency Instrumentation
custom_spankafkae2e_latencymedium_complexity
Gap Identified: Lack of end-to-end latency tracking across Kafka pipelines makes it difficult to measure delivery performance and detect anomalies.
Suggested Approach: Add a custom span at the message producer and propagate context through Kafka headers to the downstream consumer. Calculate latency from enqueue to business outcome processing.
Attributes to Capture:
message.idtopic.nametenant.idproducer.serviceconsumer.servicedelivery.status
Impact: Enables tracing and alerting on message delivery delays by tenant, topic, and service. Supports anomaly detection and SLA validation for key business workflows.
Sample Code:
// Producer-side instrumentation
  const tracer = opentelemetry.trace.getTracer('chat-app');
  
  async function produceMessage(message, context) {
    const span = tracer.startSpan('message.delivery.start', {
      attributes: {
        'message.id': message.id,
        'topic.name': 'chat-messages',
        'tenant.id': context.tenantId,
        'producer.service': 'chat-service'
      }
    });
  
    const headers = {};
    opentelemetry.propagation.inject(opentelemetry.context.active(), headers);
    await kafkaProducer.send({
      topic: 'chat-messages',
      messages: [{ key: message.id, value: JSON.stringify(message), headers }]
    });
  
    span.end();
  }
  
  // Consumer-side instrumentation
  async function handleMessage({ message }) {
    const ctx = opentelemetry.propagation.extract(opentelemetry.context.active(), message.headers);
    await opentelemetry.context.with(ctx, async () => {
      const span = tracer.startSpan('message.delivery.end', {
        attributes: {
          'message.id': message.key.toString(),
          'consumer.service': 'notification-service',
          'delivery.status': 'processed'
        }
      });
  
      await processMessage(JSON.parse(message.value));
      span.end();
    });
  }

I’ve created an updated diagram of the end-to-end latency through the Kafka pipelines and included the business outcomes we are tracking. Note the anomaly in the first producer.

Alt text

Slash costs and future-proof with open source. But only when you're ready.

Remove vendor lock-in and prepare for the future with OpenTelemetry. Migrate from proprietary data collection in weeks, not months.
Migrate our telemetry from hot-shots to OpenTelemetry. Use best practices.

Here is a sample of the OpenTelemetry instrumentation generated. I created 3 new PRs to migrate the repo in scope. Would you like to see details?

const span = tracer.startSpan('db.find.all');
const startTime = Date.now();

db.find({}, function (err, docs) {
  const dbDuration = Date.now() - startTime;

  if (err) {
    span.setStatus({ code: SpanStatusCode.ERROR });
    span.setAttribute('error', true);
    databaseErrorsCounter.add(1, { operation: 'find_all' });
    span.end();
    return response.status(500).json({ error: err.message });
  }

  // OpenTelemetry metrics
  databaseQueryDurationHistogram.record(dbDuration, { operation: 'find_all' });
  databaseRecordsGauge.add(docs.length, { operation: 'find_all' });
  databaseOperationsCounter.add(1, { operation: 'find_all', status: 'success' });

  // OpenTelemetry span attributes
  span.setAttribute('db.records.count', docs.length);
  span.setAttribute('db.operation', 'find_all');
  span.end();

  response.json(docs);
});
Blue background
How it works

Define your needs. Sylogic's AI does the rest.

AI agents can set up observability, add custom instrumentation, keep your telemetry up to standards, resolve issues, and migrate to OpenTelemetry.

Define Your Intent

Use policy templates built on hyperscaler best practices. Tailor with your business context & goals.
1

Suggests SLO Implementation

Converts SLOs into observability configs + code instrumentation.
2

Enhances Existing Observability

Adds consistent and rich business context to your traces.
3

Continuous Learning

Automatically optimize cost + benefits of observability posture.
4

Expand your observability team, without expanding headcount

Add Hyperscaler expertise to your stack

Our team built observability at scale for the world's most demanding environments. Now, that expertise powers your success.

OpenAIGoogleMetaNvidiaIBM Cloud

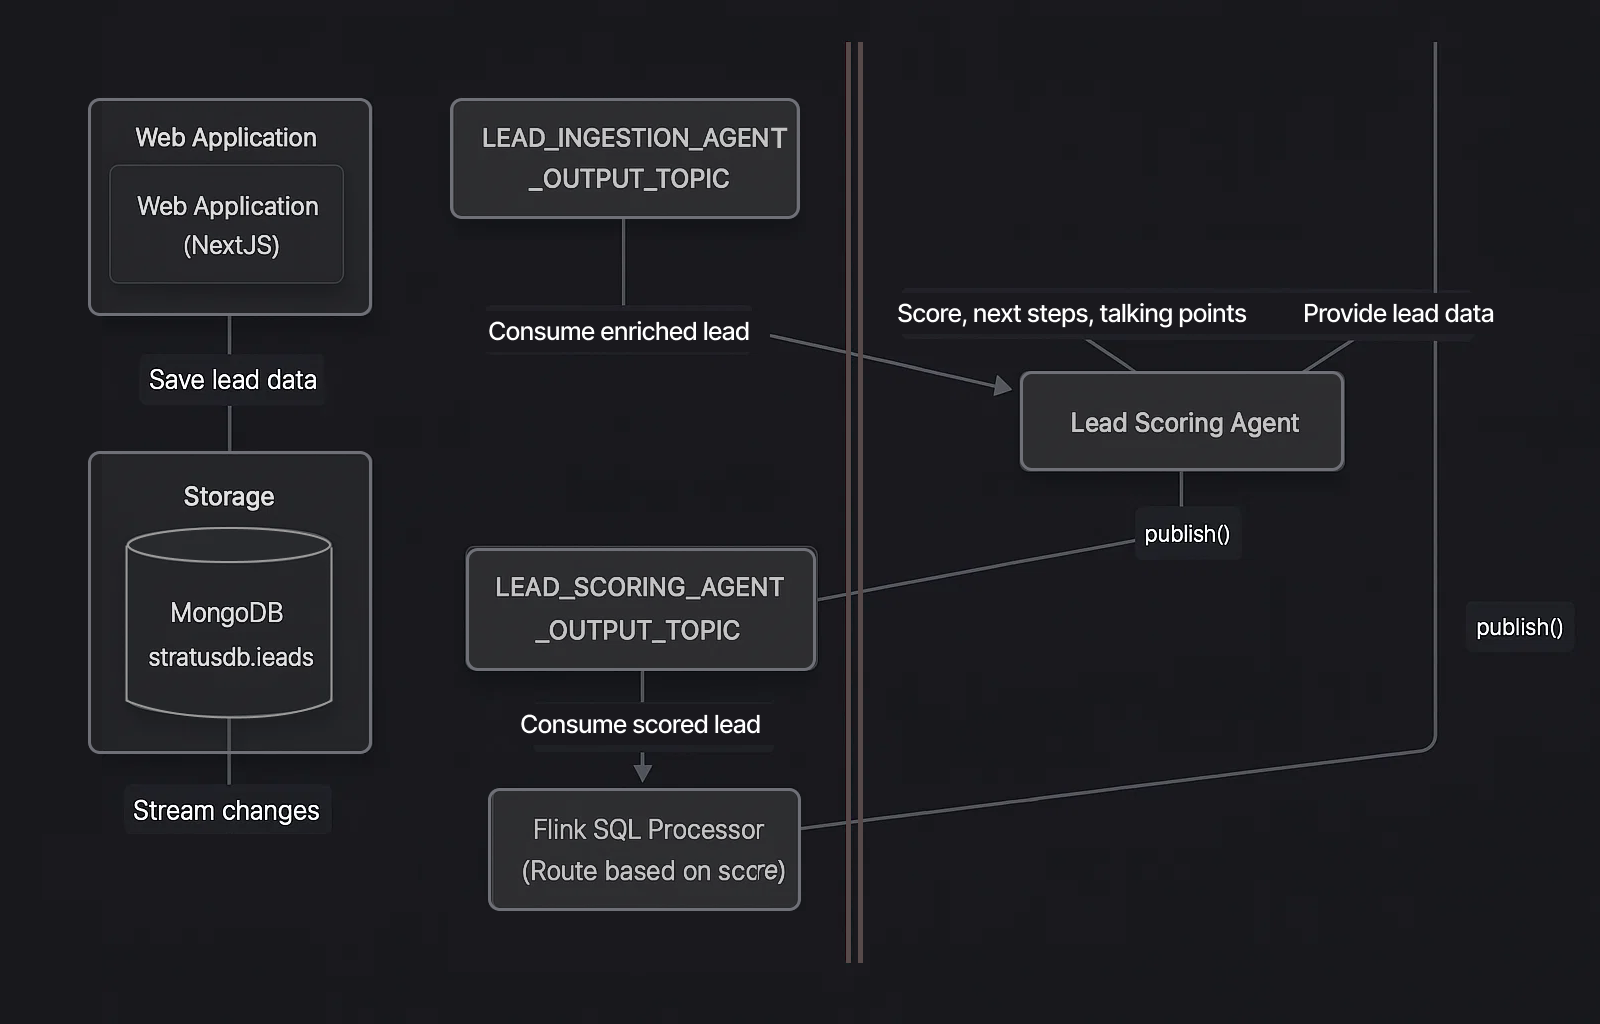
Business-aware telemetry that accelerates product development

Add business-context rich traces in your code. No more grepping infinite logs to find the bug in your micro-services.

Error rate > 1% for users in onboarding flow Availability < 99.9% for high-value customers in EuropeJob failure rate > 0.5% for scheduled report generation for paid accountsError rate > 1% for users in onboarding flowAvailability < 99.9% for high-value customers in EuropeJob failure rate > 0.5% for scheduled report generation for paid accounts
Timeouts > 5/min during checkout process for users with cart_value > $500Latency spike > 2x normal for new feature flagged users in A/B test95th percentile query time > 300ms for searches by power users Timeouts > 5/min during checkout process for users with cart_value > $500Latency spike > 2x normal for new feature flagged users in A/B test95th percentile query time > 300ms for searches by power users
SLO burn rate exceeds threshold for contracts with SLA penalty clausesData sync failures for external integrations used by strategic partnersHigh CPU usage > 85% during batch invoice runs for enterprise accountsSLO burn rate exceeds threshold for contracts with SLA penalty clausesData sync failures for external integrations used by strategic partnersHigh CPU usage > 85% during batch invoice runs for enterprise accounts

Enforce SRE best practices across all your apps

Centralized, SLO-driven automation of the observability posture across your organization. Sylogic detects any config or code changes and immediately recommends adjustments to telemetry to maintain your standards.

Reduce the cost of operating observability

Automate repetitive labor prone to human error. Reduce the "firehose" by collecting just the data you need.

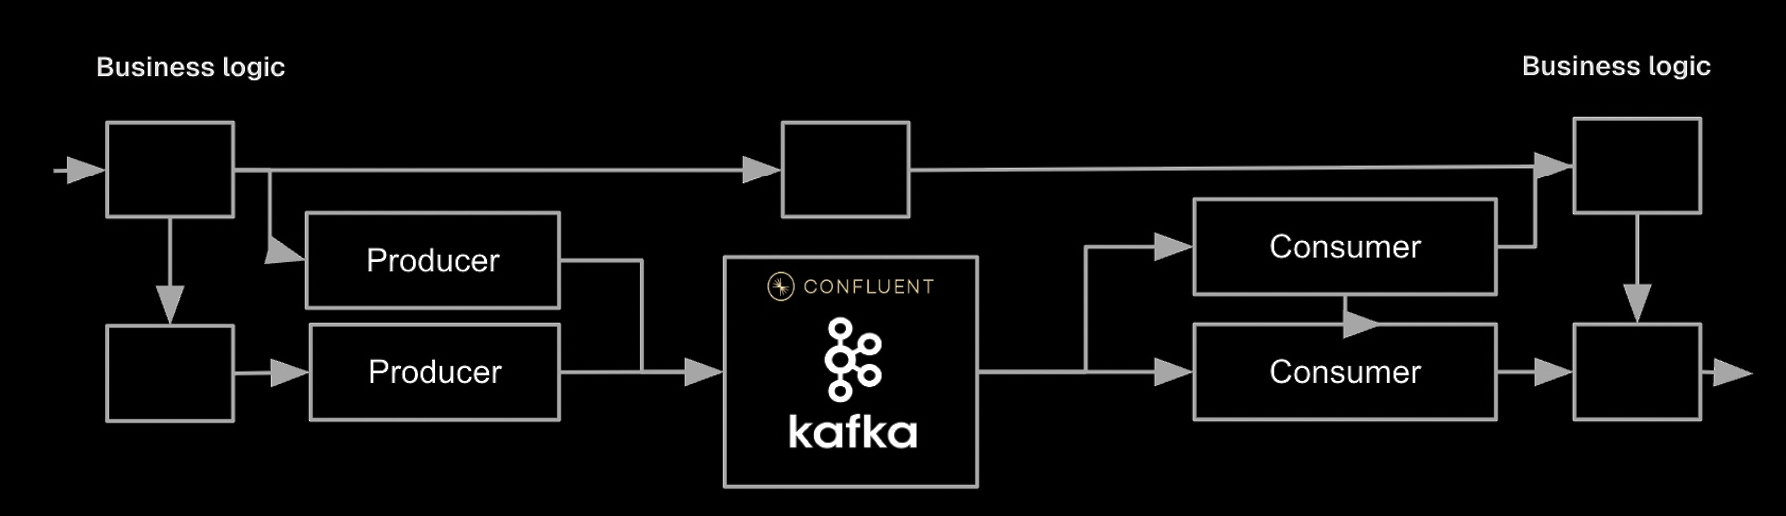
Integrates into your existing stack

Sylogic learns about your context from code repos, tickets, documents and conversations, and interfaces with your observability platform to optimize code instrumentation and data pipelines.

Logo
Logo
Logo
Logo
Logo
Logo
Logo
Logo
Logo
Logo
Logo
Logo

The AI observability landscape

General AI copilots?

AI copilots focus on individuals, not org-wide policy automation
General tools lack Sylogic's deep observability expertise to generate accurate, trustworthy results

Observability vendor AI agents?

Focus is downstream—analyzing messy, incomplete telemetry to help with RCA
Doesn't solve the root problem: consistent, high-value telemetry that gives superpowers to your SREs (human or AI!)
Sylogic Background

Sylogic AI

Centralized, consistent policy-driven automation across your org
Deep observability expertise
Tackles the root problem—improving telemetry at the source

Simple to evaluate, deploy & scale

1

Run Trial in Minutes

Connect a Github repo. Run a coverage and gap analysis. Identify ROI and impact. Risk-free evaluation: read-only access, no cost.

2

Platform Rollout in Days

Implement new policies. Manage your observability posture with our agents. Optionally migrate to open source.

3

Faster Innovation...

Sylogic automates proactive reliability standards across the organization so your teams can focus on building. Business-IT alignment achieved!

Get started with an observability gap report